Blog
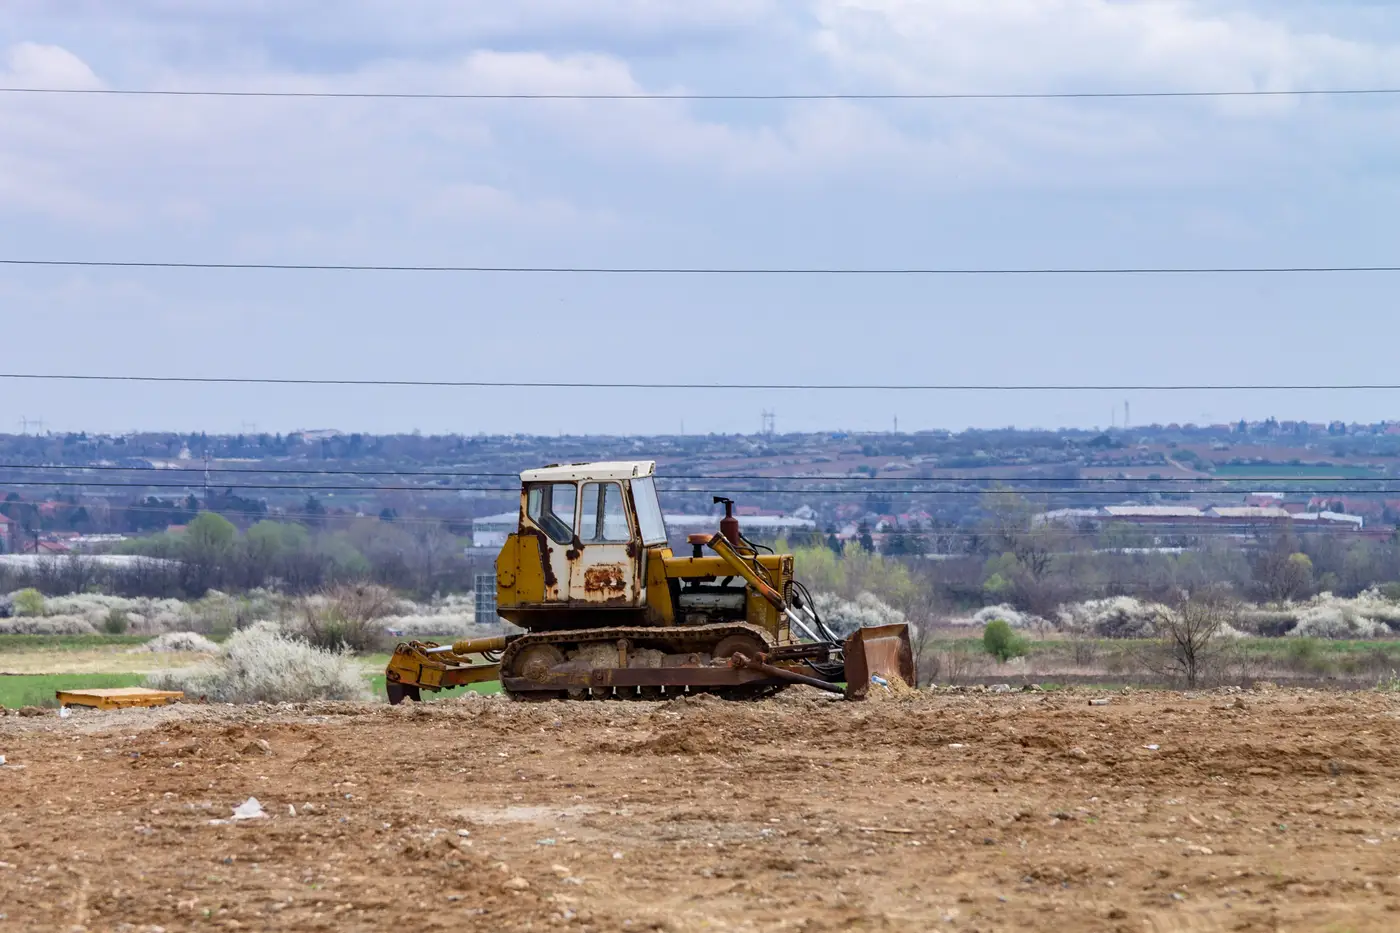 The account everyone called flush, until the fourth pass
A territory manager's best account looked like a fleet-refresh showcase for three passes straight. The fourth pass told a different story.
 Sales planning territory vs service territory: how OEMs draw the lines differently
Why a dealer's sales planning boundary and its service territory rarely match, and what that mismatch means for timing a fleet replacement push.
 Segmenting a dealer territory by fleet age distribution
How to break a dealer territory into fleet age segments by site instead of one territory-wide average, using arrival and departure data.
- What a fleet age curve tells you about when to run a replacement campaign
A plain explanation of the fleet age curve, what the shape means for a dealer site, and how to use it to time a replacement campaign.
- Field notes: the territory that topped the list until we split it by machine type
A dealer territory ranked first for fleet turnover, until we broke the count down by machine class and found the real story underneath.
- What a fleet refresh rate is and how it gets calculated from quarterly passes
A plain explanation of fleet refresh rate, how quarterly site passes turn into a turnover number, and why it beats guessing from memory.
- Seasonal rental returns vs. real fleet turnover at a dealer site
How to tell a rental return spike from an actual fleet replacement at a dealer yard, pass by pass instead of by one snapshot.
 Replacement window vs. trade-in cycle: what's the difference?
A replacement window and a trade-in cycle aren't the same clock. Here's what each one measures and why mixing them up costs you a sale.
- Field notes: the dealer who called three times before the fleet actually turned
A territory manager's gut said a yard was overdue for replacement. The quarterly record said otherwise, until it didn't.
- What is a turnover map in equipment sales planning?
A turnover map tracks which machines show up and leave a dealer's customer sites each quarter, so you know which yards are due for replacement.
- How to time a model-year refresh campaign to a dealer's fleet age
A practical approach to timing model-year refresh campaigns around real dealer fleet turnover, not a calendar date sent to every territory.
- Trade-in clusters on a dealer lot: what actually counts
A trade-in cluster isn't any group of used machines. Here's how to tell a batch fleet swap from ordinary lot churn on a quarterly pass.
- How to calculate average dwell time for machines on a dealer lot
A step-by-step method for tracking how long equipment sits at customer sites in a dealer territory, and why the math gets hard past a handful of yards.
- How to read an arrival/departure timeline for a dealer site
What arrivals, departures and hold-overs on a dealer-site timeline mean, and how to spot a yard closing in on its next replacement window.
- How to estimate dealer fleet age without a yard walk
Methods for estimating dealer-territory fleet age when you can't drive every yard this quarter, and where each one breaks down.
- How to prioritize dealer territories for a replacement campaign
A ranking method for OEM sales planners choosing which dealer territories get replacement campaign dollars first, based on fleet age and turnover.
- How to tell new inventory from trade-ins in a dealer yard from the air
Aerial and satellite imagery can't label a unit new or trade-in. Here's what it can show, and how arrival and departure patterns do the rest.
- What counts as a stale unit on a dealer lot
A plain breakdown of dealer lot aging buckets, why 90/180-day flags on new inventory miss the real turnover story in the field.