Seasonal rental returns vs. real fleet turnover at a dealer site
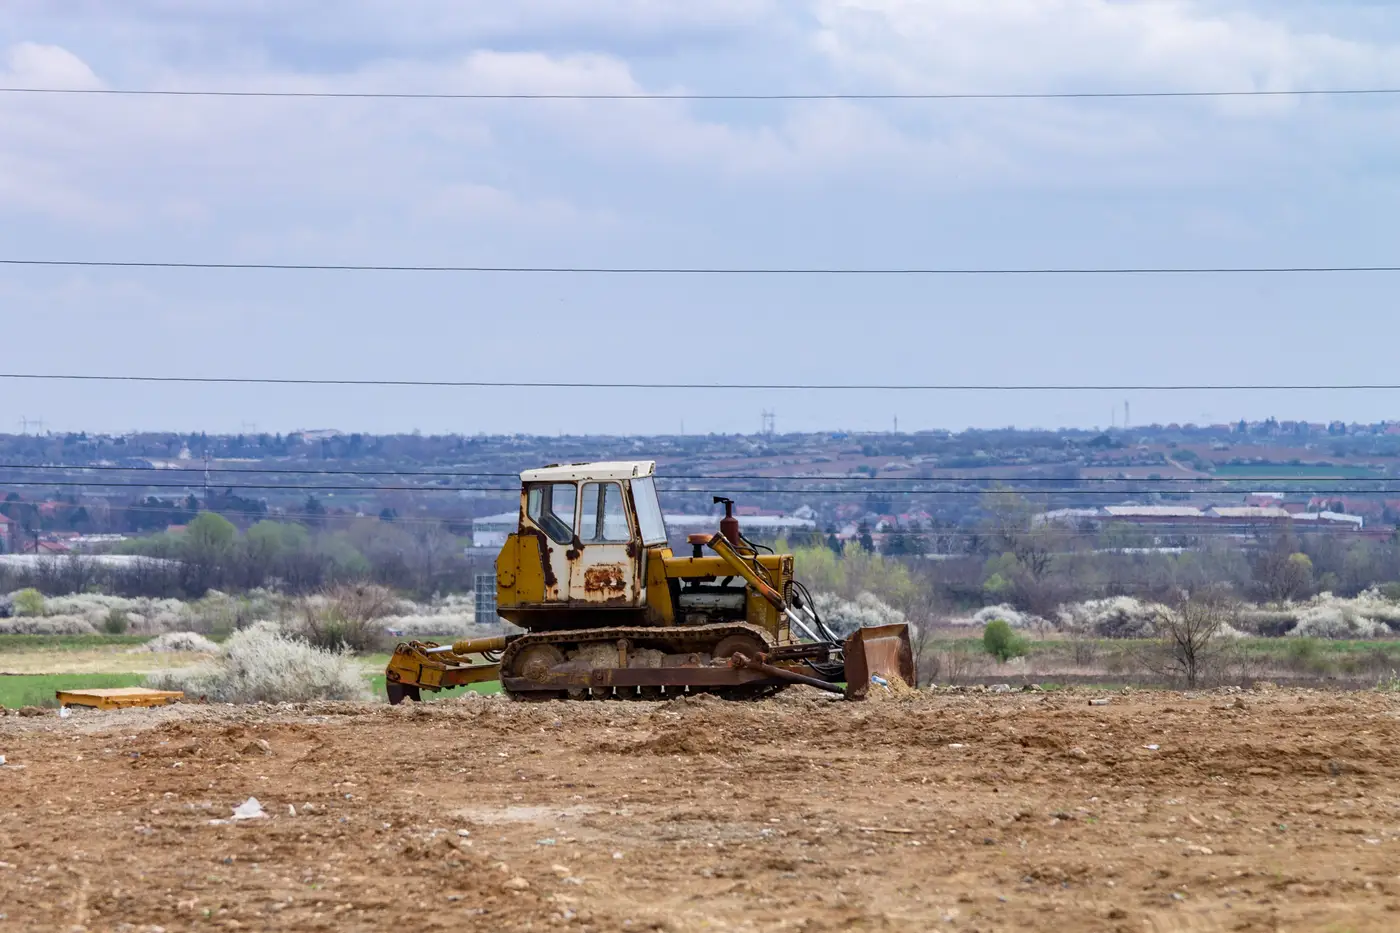
Every spring and again every fall, a handful of yards in your territory look like they turned over half their fleet overnight. A pile of machines shows up, a pile leaves, and if you're reading that off a single pass, it looks like the dealer just replaced a chunk of the lot. Usually it didn't. It rented.
Rental return season does that to a yard. Construction and ag rental houses push units out hard at the start of the season and pull them back hard at the end, and for two or three weeks the on-site count can swing 20-30% in either direction. If your read on which sites are due for a replacement campaign comes from one snapshot, or from a rep's drive-by that happened to land during a return week, you'll flag yards that aren't aging out, and you'll miss the ones that are.
What a rental spike looks like next to real turnover
The tell is in the pattern across passes, not the count on any single pass.
A rental return spike: a batch of machines appears in the yard, then within a quarter or two that same batch, or a similar-aged batch, is gone again. The units that show up are the same model years cycling back through on the return schedule. Average machine age on site barely moves, because nothing actually got replaced.
Real fleet turnover: older units leave and don't come back, newer units show up and stay through the next pass and the one after that. The yard's average age drops too. That's the signal a replacement campaign already happened, or is underway.
Looking at raw unit counts quarter to quarter, both events can produce the same-looking spike. A yard with 40 machines that jumps to 55 then back to 38 reads identically whether it's rental churn or a dealer clearing old inventory ahead of a new allocation, unless you're tracking which specific machines came and went instead of just how many.
Reading arrivals and departures instead of headcount
The fix is tracking individual arrivals and departures per site across at least three passes. One quarter tells you the yard changed. Three quarters tell you whether it changed and stayed changed.
In practice that means watching for a few patterns:
- A machine present on pass one, gone by pass two, with the slot refilled by pass three by a different unit. That's turnover, especially when the age gap between the old unit and its replacement is wide.
- A machine present on pass one, gone by pass two, then a near-identical unit back again by pass three. That's a rental cycle, not a replacement.
- A site where the same units have sat for three or more passes running with no arrivals or departures at all. That's an aging fleet worth a call regardless of season, since nothing's moving.
Sites near a rental yard, or dealers with a rental-heavy book, tend to show this churn around the same two windows every year. Once you've watched a site's pattern through a full annual cycle, the seasonal bump stops reading as a signal and starts reading as the noise it is.
That's hard to sort out from memory, or from comparing two drive-by photos taken six months apart. It's straightforward once you've got a dated record of what sat where across several passes, which is the gap Fleet Turnover Monitor tracks: a quarterly read on each customer site that follows specific machines in and out, so a rental-season bump and a replacement window don't land on your call list as the same thing.
Before your reps spend next quarter chasing "turned over" sites, it's worth checking which ones are just rental churn waiting to swing back the other way.
Want a dated arrival-and-departure timeline for your own dealer sites instead of guessing from the last drive-by? That's what Fleet Turnover Monitor builds.